Portfolio Construction Based on Robust Covariance Matrix Estimation


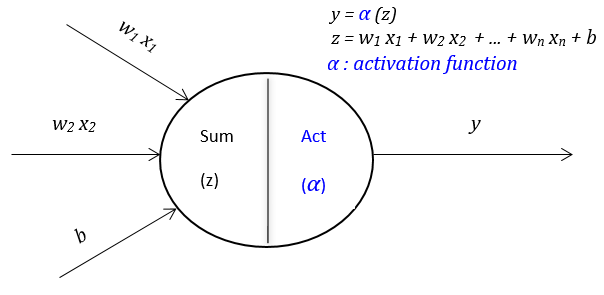
According to the CAPM model, the relationship between premium return of individual share and that of S&P 500 should be approximately linear.
\[r_{i} - r_{f} = \beta_i (r_{m} - r_{f})+\epsilon_{i}\]
However, when we contemplate the two variables, it is not difficult to realize that their relationship can never be linear. S&P 500 as a market index, its return is made up by weighted returns of individual shares. The individual shares' return might be more volatile when the market's return approaches its sample mean.
Therefore, when market return is close to zero, we can hardly derive any useful information to predict the return of individual stock. You can find this phenomenon from the scatter diagram below.
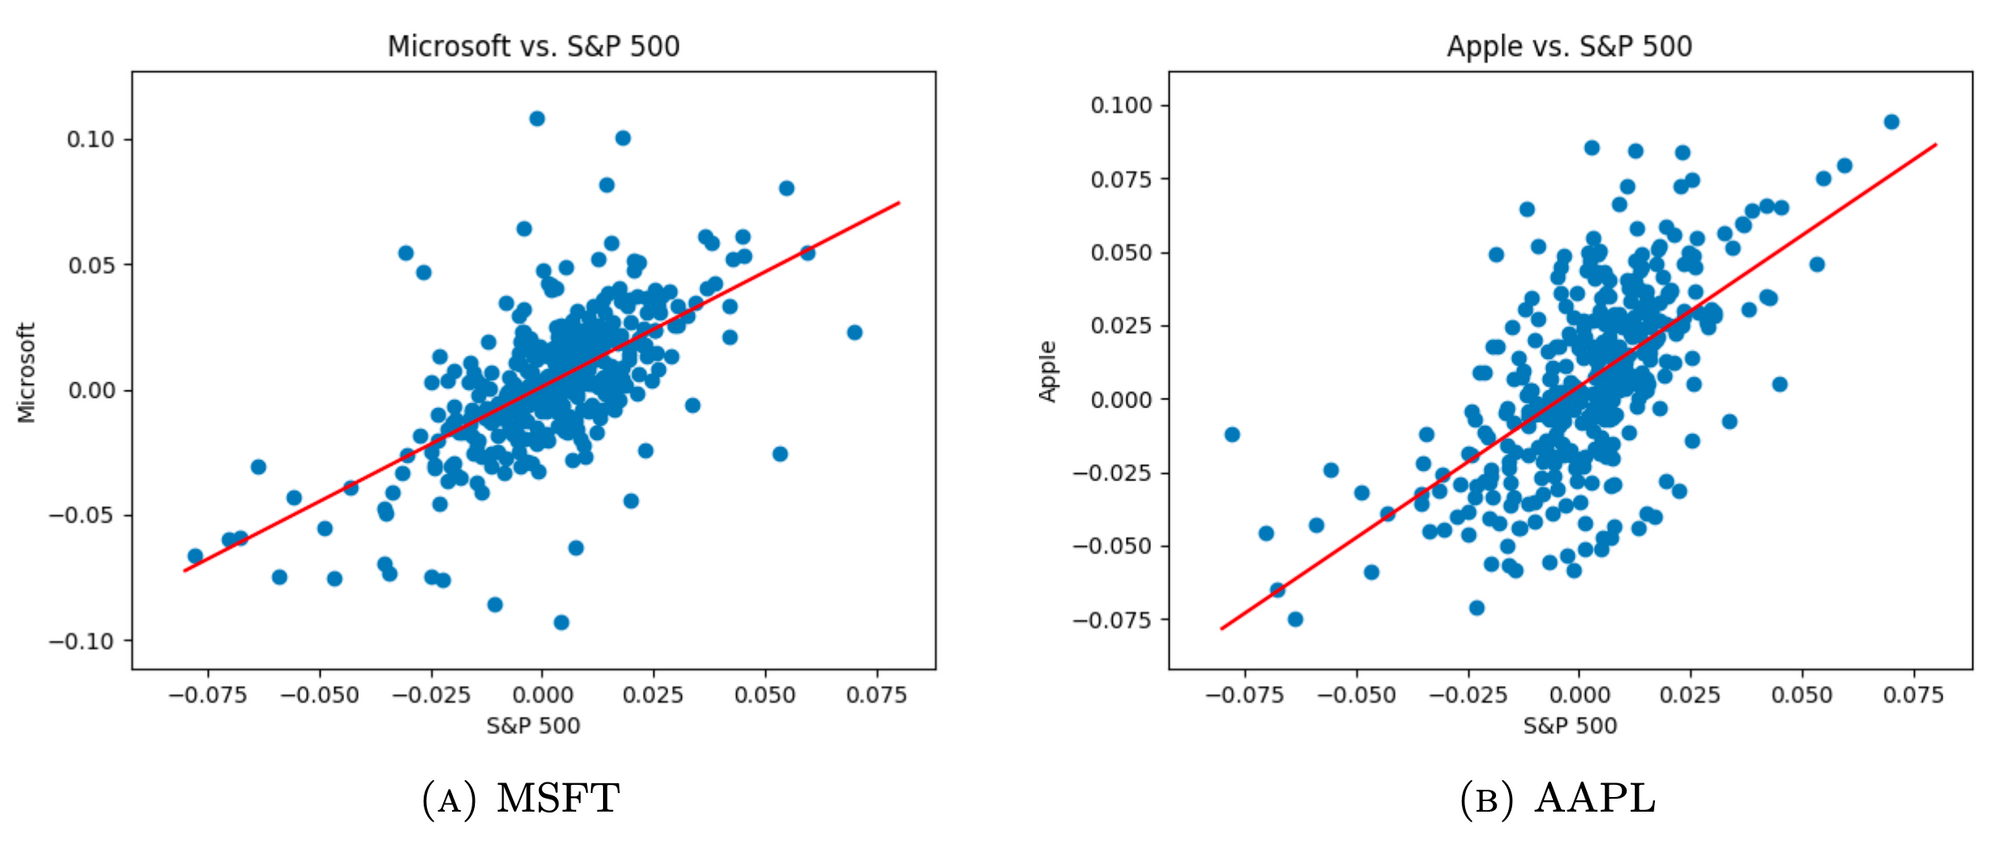
We can see that there are a lot of noise when market return close its mean. By dividing the data into two parts, one is near the mean, the other is apart from the mean, we can process the data separately.
When the market return fall in the interval \([\mu - \sigma, \mu + \sigma]\), we call it normal market. Otherwise, we call it extreme market. The linear relationship between return of individual stock and return of the market will be more obviously in the extreme market.
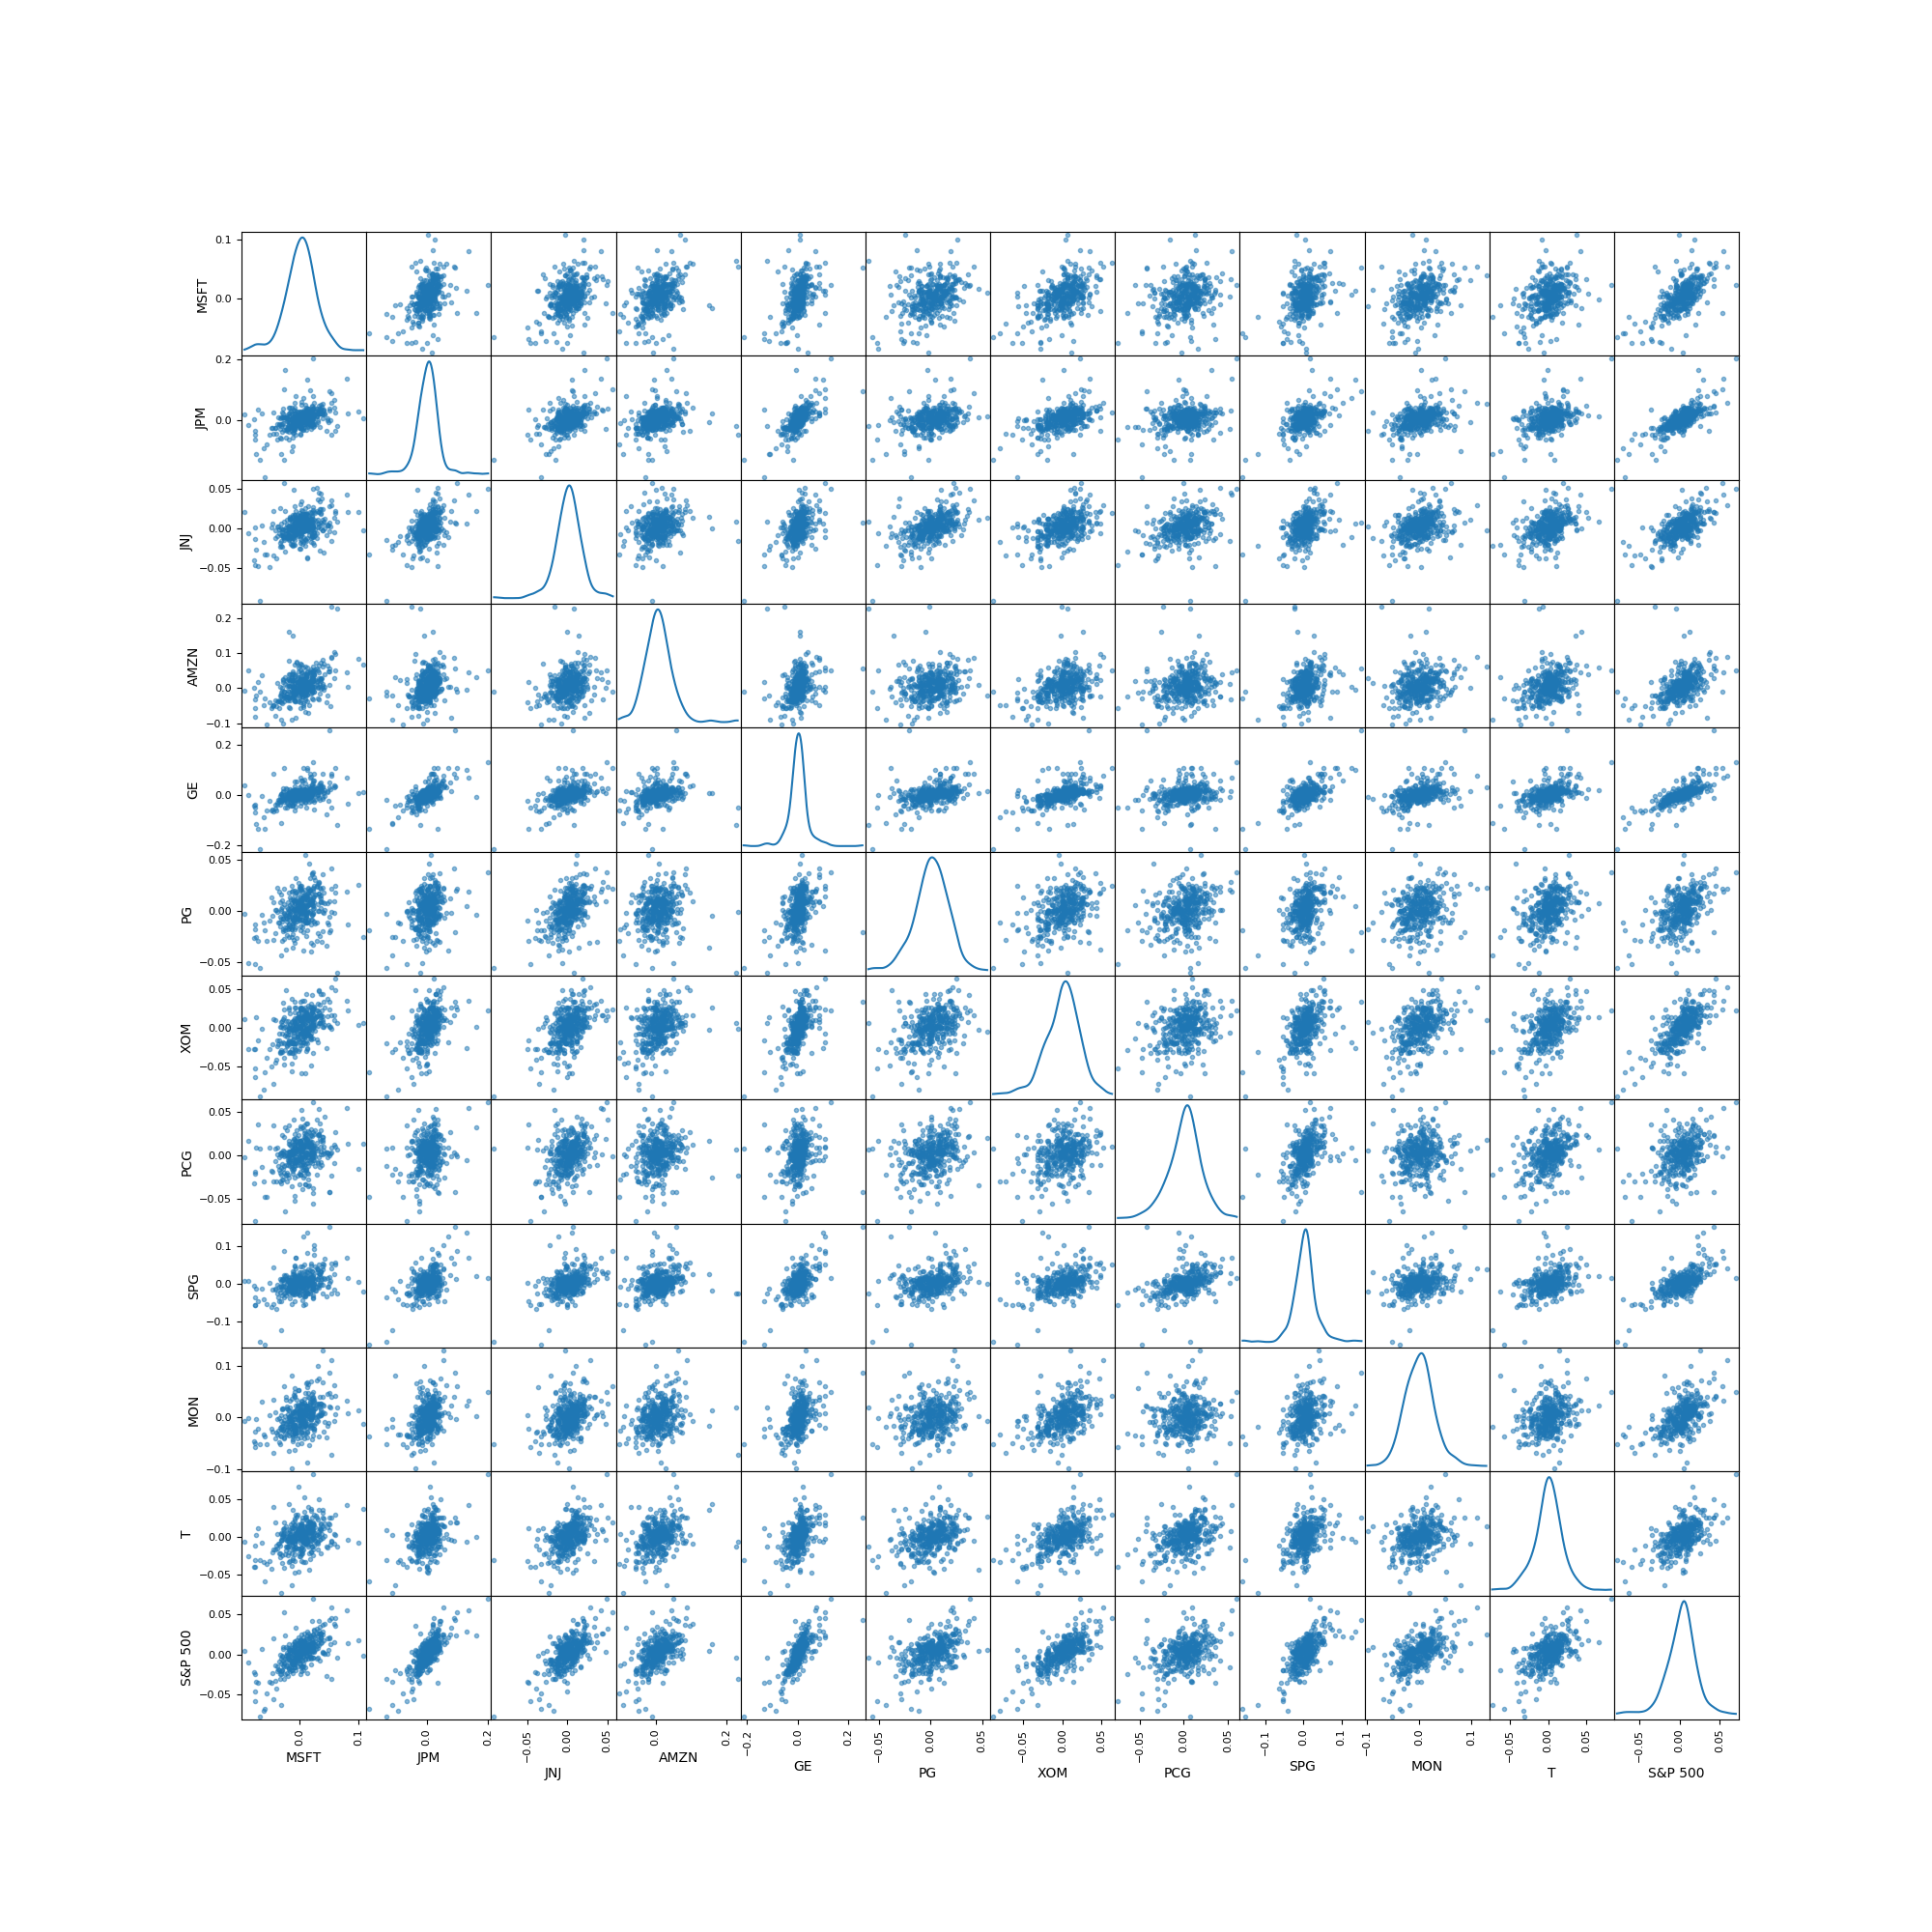
To demonstrate it more generally, we choose 11 individual stocks and S&P 500 index as our research object. From the scatter matrix below, we can see the relationship between the individual stock returns and market return are quite noisy.
Now let's remove the noisy data and take a look at the linear relationship in the extreme market.
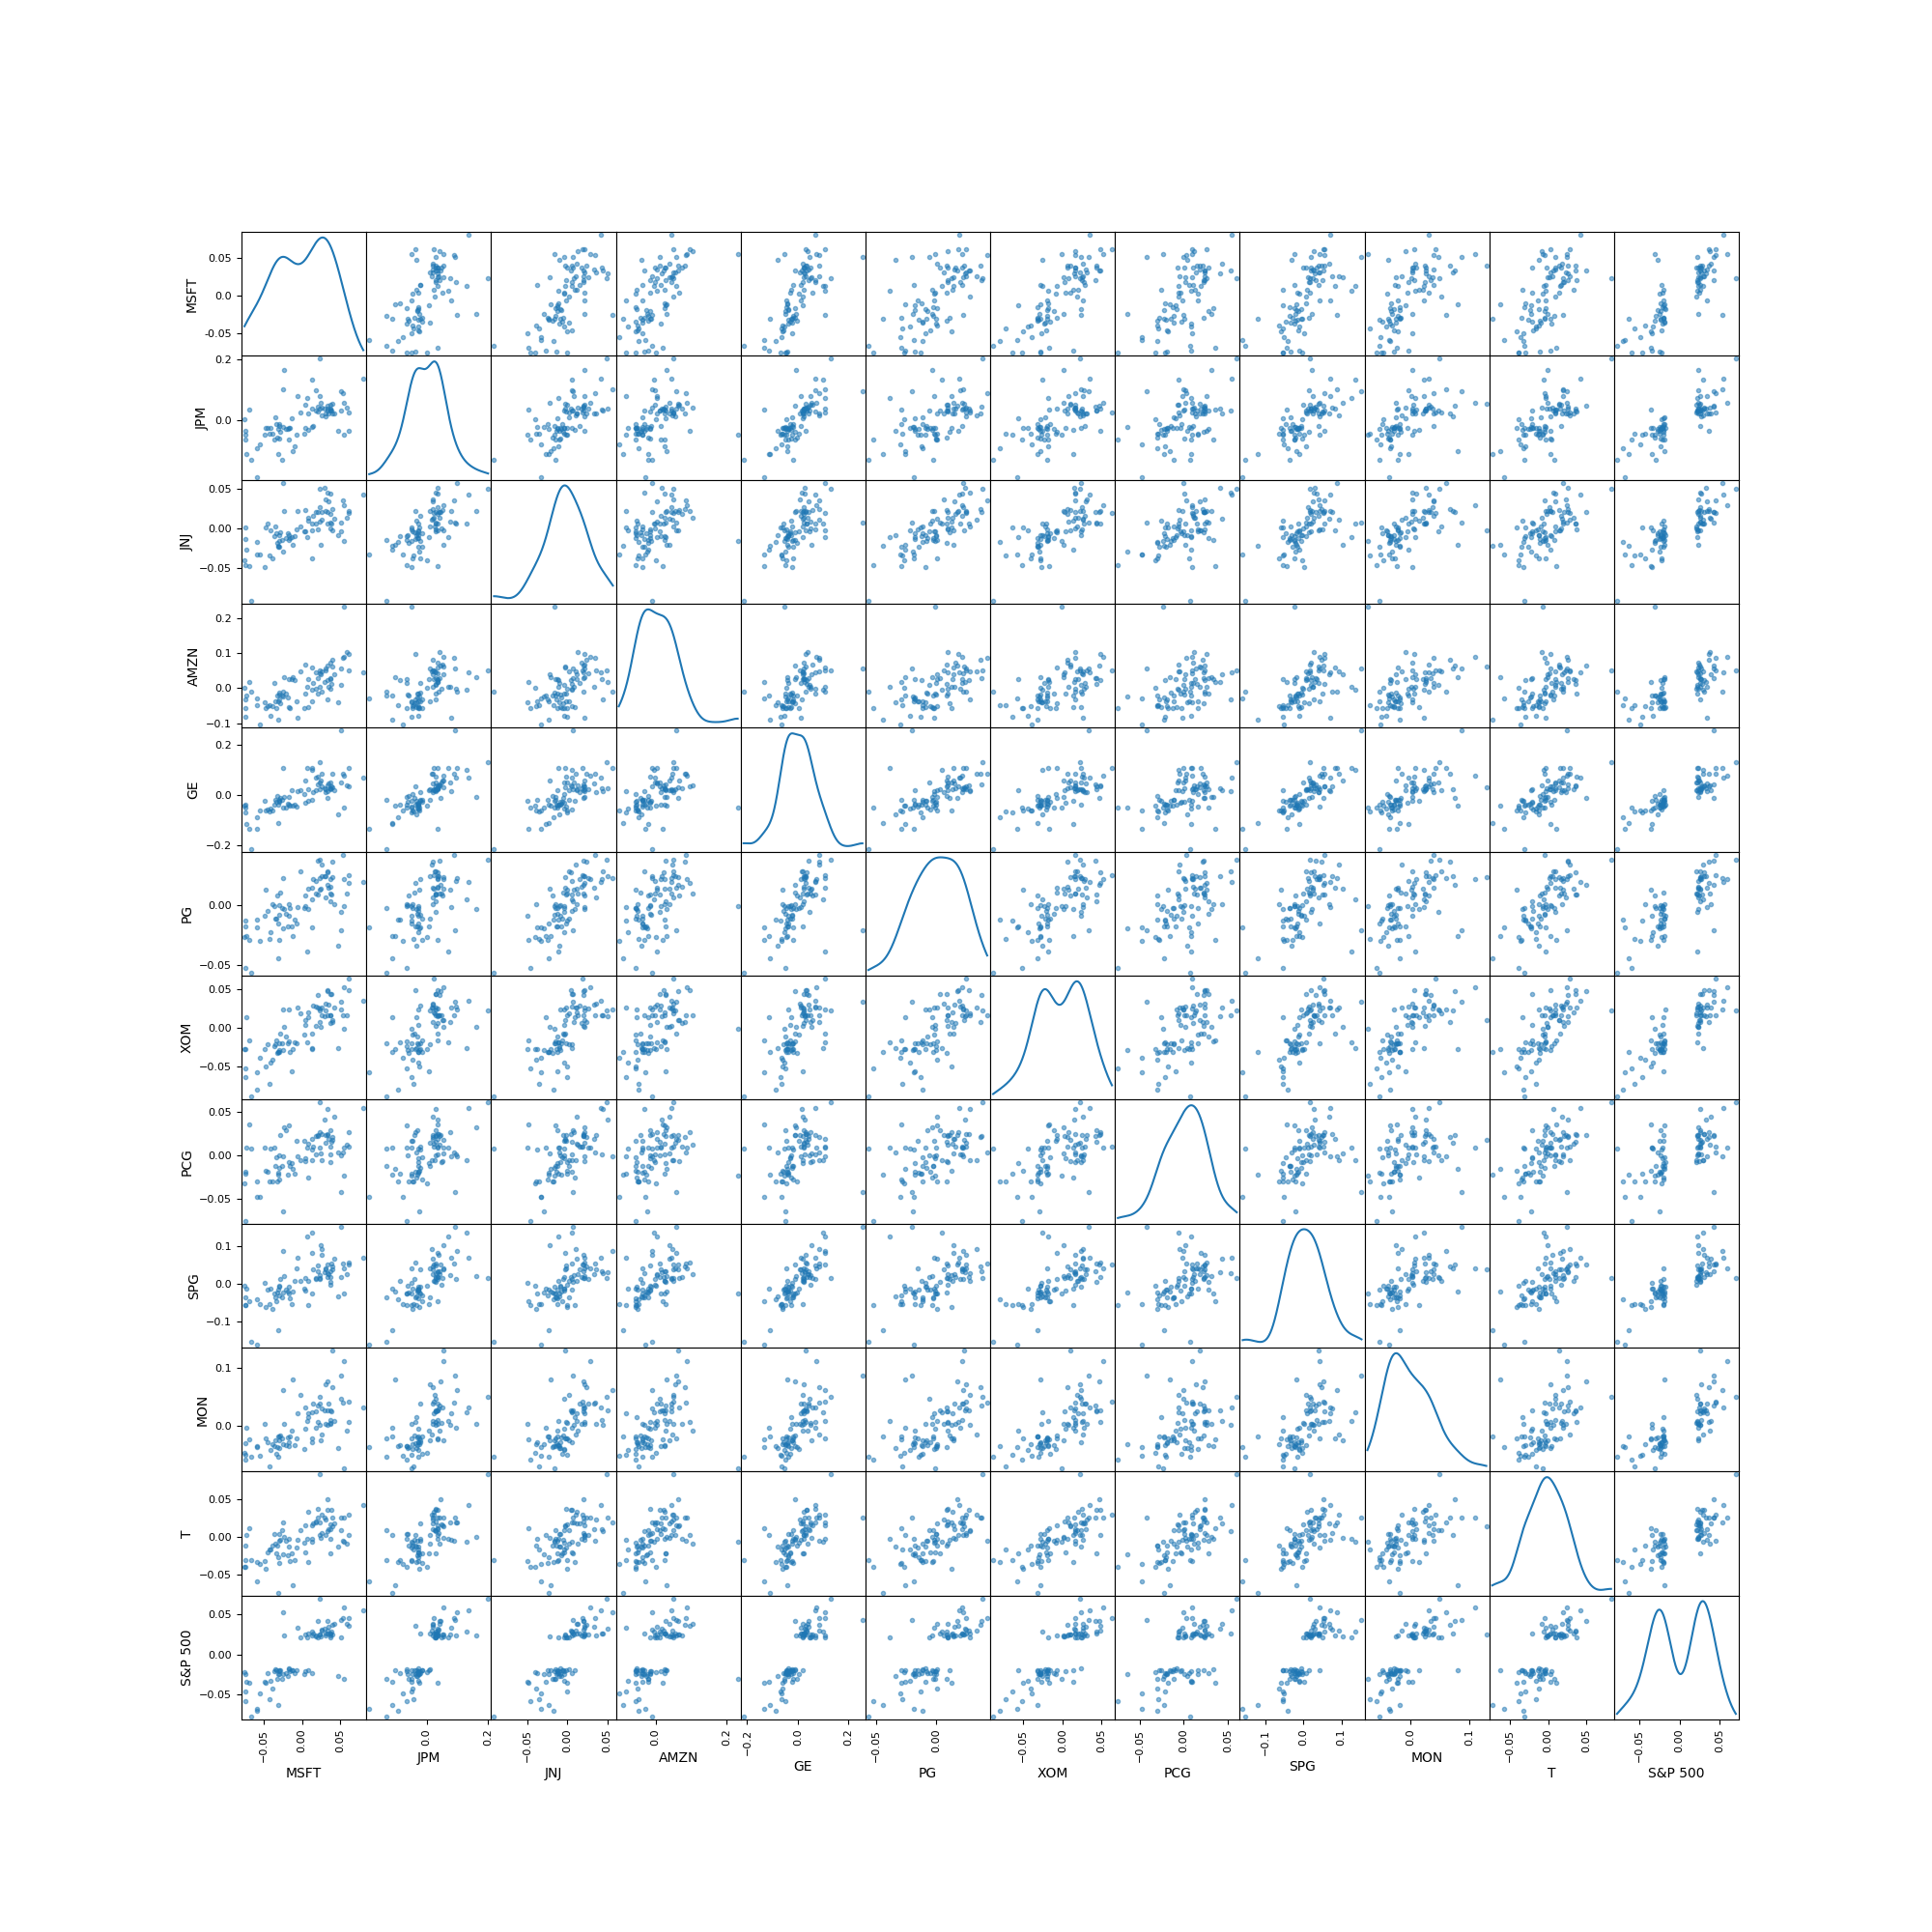
The linear relationship gets more clearly now.
As we know, to estimate the covariance matrix \(\Sigma\) or the precision matrix \(\Theta\) accurately is the most important and crucial part in construction of Markowitz optimal portfolio. Some distinguished and complex methods, including rank-based method and factor-model-based method, have been proposed to estimate the covariance matrix. These methods are persuasive and general.
However financial data has its own peculiarities, some general appoaches are not appropriate or applicable in financial world. For instance, in some estimation methods, we assume that \(\Sigma\) is sparse and set a threshold for the element in covariance matrix. This approach will definitely ignore some less correlated stocks, which are very crutial when we construct Markowitz optimal portfolio.
Furthermore, the acdemic approaches mentioned above usually involves more mathematical and statistical theory, and are more computationally expensive. All these drawbacks restrict their application to financial industry. Through cutting off noisy data, we obtain a new sample covariance matrix, which leads to a rubost estimate of the covariance matrix.
To reduce the complexity of algorithm, which is important when we treat high dimensional problem, we consider to use \(\beta\) values in CAPM model to estimate \(\Sigma\) instead of using sample covariance matrix directly. Now we have three methods to estimate \(\Sigma\):
- Using the sample covariance matrix computed on the whole dataset.
- Using the sample covariance matrix computed on extreme market dateset -- simple robust covariance matrix estimation
- Using the CAPM-derived covariance matrix computed on extreme market dateset -- robust covariance matrix estimation based on CAPM's beta.
We choose 25 main component stocks in S&P500, and take these stocks' weekly return from January 2010 to December 2016 as training set, meanwhile we take the data set of weekly return from January 2017 to August 2017 as test set. Along with naive portfolio, also known as equal weighted portfolio, we display the performance of the four portfolio as follows.
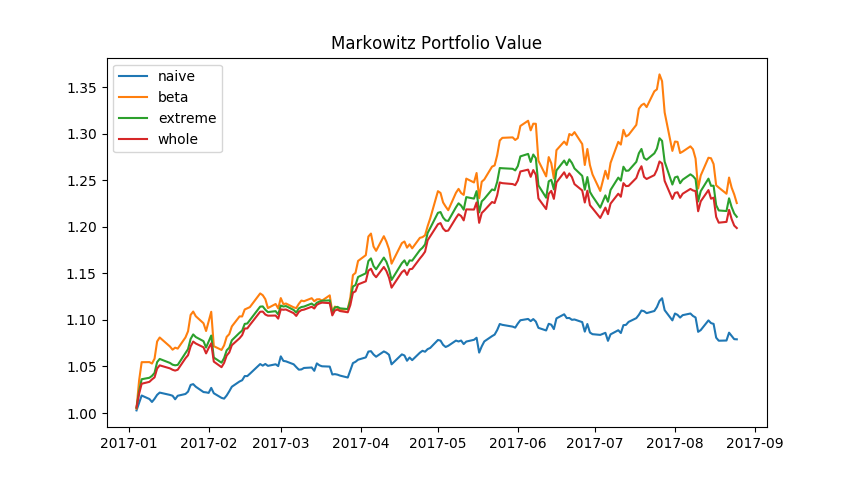
We can see from the figure above that the robust covariance matrix estimation based on CAPM's beta achieves the best performance. It is followed by simple robust covariance estimation. On its heels, the traditional sample covariance. The portfolios constructed by Markowitz formula plugged-in all these three estimated covariance matrix perform better than naive portfolio.
This result is not beyond our expectation. Considering all individual stocks chosen are main component stocks in the corresponding market, their historical price data certainly contain some useful market information, which help us construct a better portfolio comparing to naive portfolio which discards all historical information.
BTW: If we use more complex factor model as we mention in previous blog, the estimation of the covariance matrix can be more accurate.